Abstract
Background. A hazard ratio expresses relative, not absolute, benefit: a statistically airtight result can correspond to a survival gain measured in years or in days. As oncology budgets tighten, funders and formulary committees increasingly need the absolute figure — and the toxicity that accompanies it — rather than the relative headline alone.
Methods. From the Froome Close research dataset (≈ 6,900 structured studies), every regimen reporting overall survival with a hazard ratio was assembled. A regimen is a “significant winner” where HR < 1 and the upper bound of the 95% confidence interval is below 1. For each, the absolute median-OS gain over its comparator was computed, and a toxicity load was derived as the count of adverse reactions occurring in more than 10% of patients, summed across the regimen’s component drugs. The marginal cohort is those with a gain greater than zero but no more than three months. This is a regimen-library audit, not a systematic literature review.
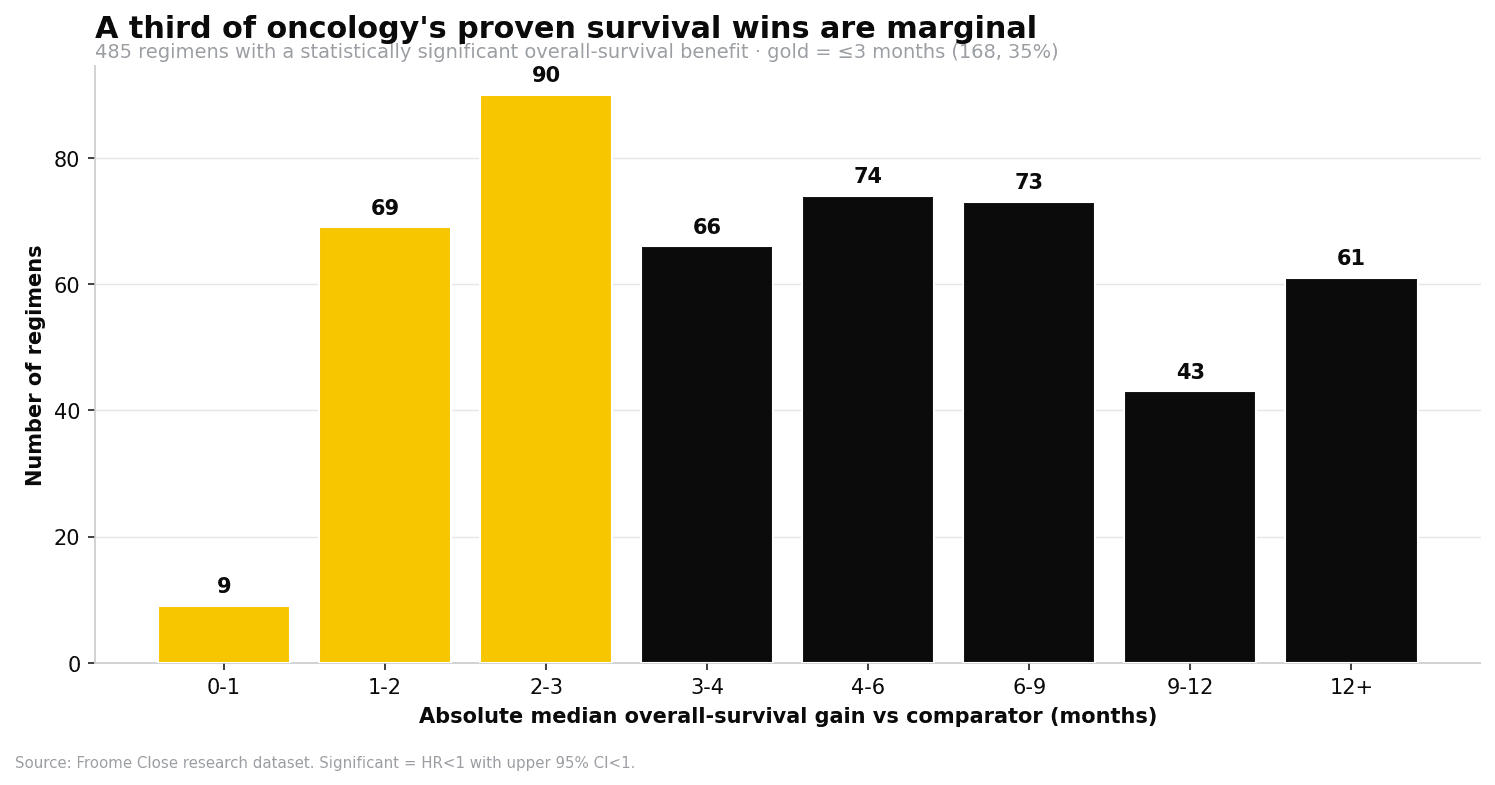
Results. 485 regimens met the significant-winner criterion; the median absolute survival gain was 4.3 months, and 168 (35%) delivered three months or less. Of 150 regimens in the marginal cohort, 131 had usable drug-level toxicity data. A low-value zone — two months or less of gain with a toxicity load at or above the cohort median of 42 — contains 25 regimens, overwhelmingly antibody- or targeted-agent-augmented chemotherapy in non-curative, later-line settings.
Conclusions. Statistical significance and clinical value have quietly diverged, and the most novel, most toxic additions to the armamentarium are not, on the whole, the ones extending life the most. Hazard ratios conceal this; a two-axis value map exposes it and is cheap to regenerate as new approvals land. The map is a triage lens for funders and manufacturers, not a clinical directive.
1. Introduction
Every new oncology approval arrives wrapped in a hazard ratio. A hazard ratio of 0.80 sounds decisive — a 20% reduction in the risk of death — and it is often statistically airtight. Yet a relative reduction says nothing about the absolute prize: whether the median patient gains two years, two months, or two weeks. That absolute figure, weighed against toxicity and price, is the number that should sit at the centre of a coverage decision.
Formal value frameworks have long argued this point,5,6 but they are applied one drug at a time, by hand. A structured outcomes library makes it possible to ask the question at the scale of the whole armamentarium: across every regimen with a proven survival advantage, how much survival are we actually buying, and at what cost in toxicity? A companion analysis examined how advanced tumours are classified for prescribed-minimum-benefit purposes;7 this note turns to that quieter, cross-cutting question.
2. Scope and definitions
The analysis is confined to regimens reporting overall survival (OS) with a hazard ratio, the endpoint most directly tied to the value question. Three definitions govern the work:
Significant winner. A regimen whose HR against its comparator is below 1 with the upper 95% confidence bound also below 1.
Absolute OS gain. The median OS of the regimen arm minus that of the comparator arm, in months. Mirror comparisons were de-duplicated, keeping the experimental direction.
Marginal cohort. Significant winners whose absolute OS gain is greater than zero but no more than three months — the group the map interrogates.
3. Methods
Records were drawn from two linked components of the Froome Close research dataset: a structured catalogue of trial outcomes (efficacy, endpoint, comparator, treatment line and context) assembled from the ClinicalTrials.gov and PubMed APIs,2,3 and a curated drug-level adverse-reaction frequency catalogue.4 Absolute OS gains were computed arm-to-arm as defined in §2.
The toxicity load is a deliberately transparent index: for each component drug of a regimen, the number of distinct adverse reactions recorded as occurring in more than 10% of patients, summed across the regimen’s identifiable drugs. Multi-drug acronyms (for example FOLFIRI, CapeOx, EOX) were expanded to their component generics before counting. The index measures the breadth of a regimen’s common-toxicity burden, not the severity or grade of any single reaction; its limitations are set out in §6 and are not buried.
4. Results
4.1 The distribution of absolute benefit
Among the 485 significant winners, the distribution of absolute benefit is heavily front-loaded. 168 of them — 35% — deliver three months or less, and roughly one in six deliver two months or less. The much-cited “survival benefit” is, a third of the time, a matter of weeks (Figure 1). The median gain across all significant winners is just 4.3 months.
4.2 The marginal-benefit map
Ranking by benefit alone is only half the picture; value is benefit weighed against harm. Figure 2 plots the marginal cohort with survival gain on the horizontal axis and toxicity load on the vertical. The shaded low-value zone — two months or less of gain with a toxicity load at or above the cohort median — is where scrutiny should concentrate; its members are marked in gold.
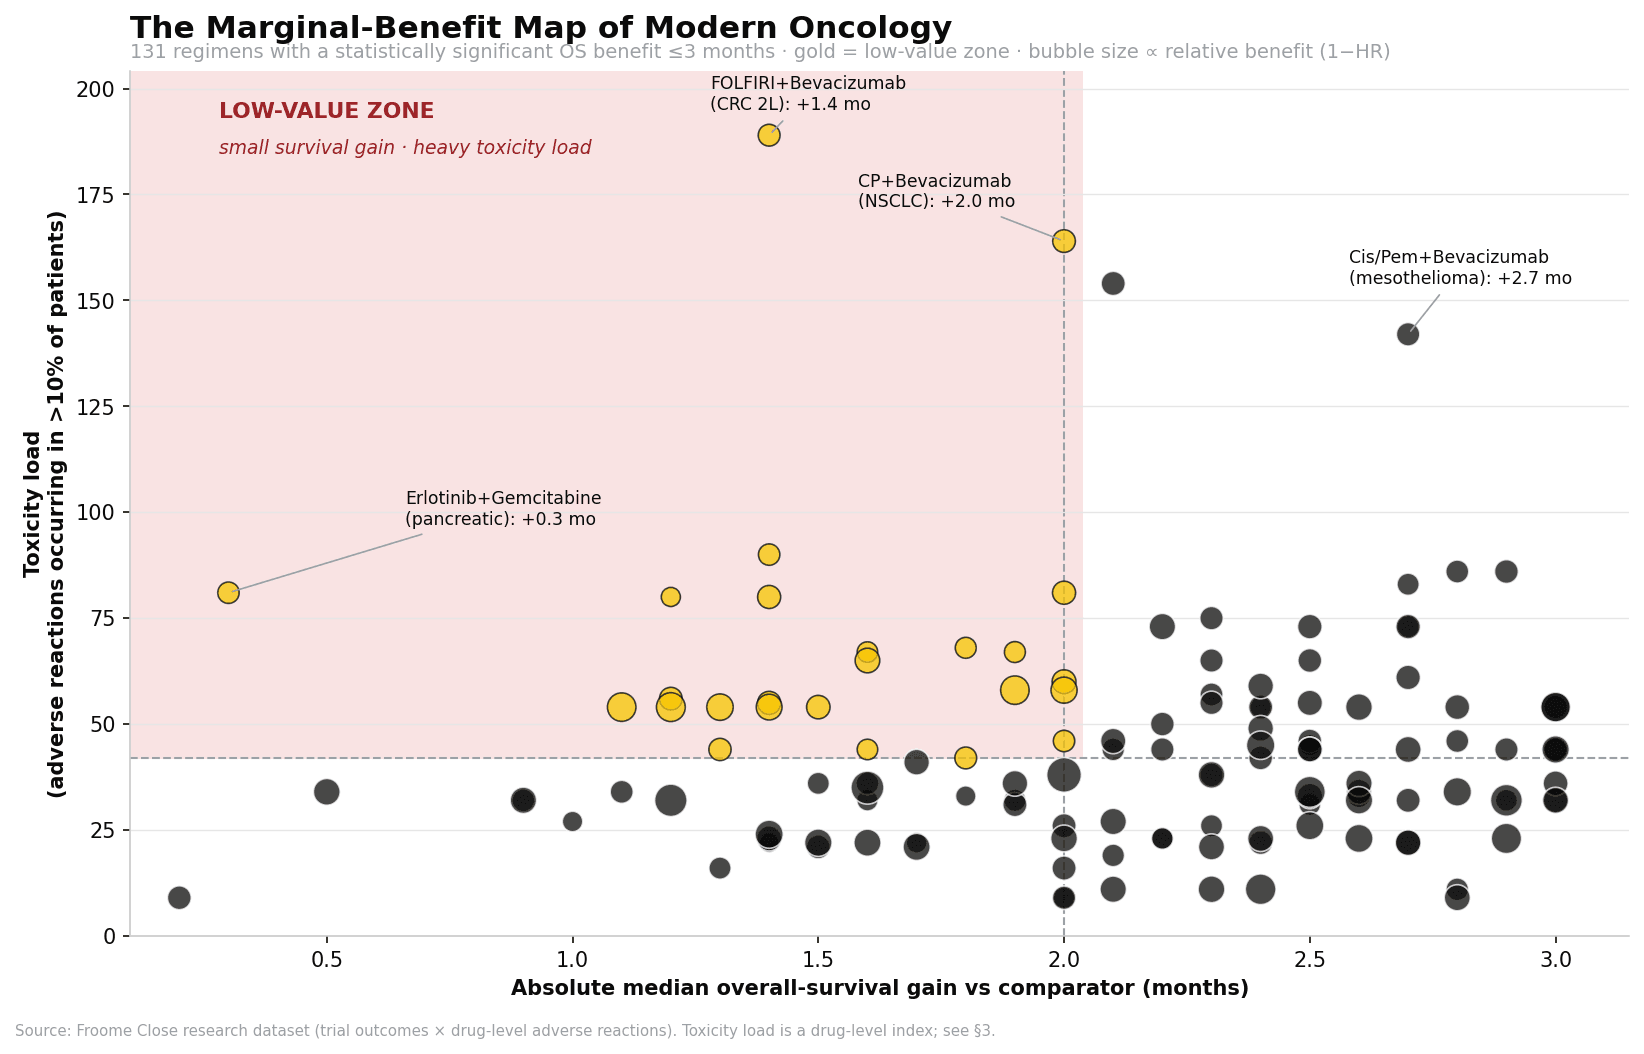
The archetype sits at the far left: erlotinib added to gemcitabine in pancreatic cancer — a statistically significant hazard ratio of 0.82, but an absolute median-OS gain of 0.3 months, about nine days, carried on a substantial toxicity load. It is the textbook illustration of a result that is real, publishable, and clinically negligible.
4.3 The low-value quadrant
Twenty-five regimens fall in the low-value zone, ranked below by survival gain then toxicity load. The pattern is striking: bevacizumab- and other antibody-augmented chemotherapy combinations cluster at the top of the toxicity scale for gains that rarely clear one and a half months.
Table 1. Regimens in the low-value zone (≤2 months OS gain and toxicity load ≥ the cohort median of 42), by ascending survival gain.
| Cancer | Regimen | HR | 95% CI | OS gain (mo) | Tox load |
|---|---|---|---|---|---|
| Pancreatic cancer | Erlotinib and Gemcitabine | 0.82 | 0.69–0.99 | 0.3 | 81 |
| Esophageal adenocarcinoma | Nivolumab monotherapy | 0.63 | 0.51–0.78 | 1.1 | 54 |
| Non-small cell lung cancer | Cisplatin and Vinorelbine (CVb) and Cetuximab | 0.87 | 0.76–0.996 | 1.2 | 80 |
| Malignant pleural mesothelioma | Cisplatin, Pemetrexed, Pembrolizumab | 0.79 | 0.64–0.98 | 1.2 | 56 |
| Gastric cancer | Nivolumab monotherapy | 0.62 | 0.5–0.75 | 1.2 | 54 |
| Acute myeloid leukemia | Gemtuzumab ozogamicin monotherapy | 0.69 | 0.53–0.9 | 1.3 | 54 |
| Gastric cancer | EOX | 0.80 | 0.66–0.97 | 1.3 | 44 |
| Colorectal cancer | FOLFIRI and Bevacizumab | 0.81 | 0.69–0.94 | 1.4 | 189 |
| Colorectal cancer | FOLFIRI and Ziv-aflibercept | 0.82 | 0.71–0.94 | 1.4 | 90 |
| Gastric cancer | CapeOx and Pembrolizumab | 0.78 | 0.7–0.87 | 1.4 | 80 |
| Gastric cancer | Cisplatin and Fluorouracil (CF) and Pembrolizumab | 0.78 | 0.7–0.87 | 1.4 | 55 |
| Small cell lung cancer | Carboplatin and Irinotecan | 0.71 | 0.53–0.94 | 1.4 | 54 |
| Colorectal cancer | Cetuximab monotherapy | 0.77 | 0.64–0.92 | 1.5 | 54 |
| Colorectal cancer | FOLFIRI and Ramucirumab | 0.84 | 0.73–0.98 | 1.6 | 67 |
| Biliary tract cancer | Cisplatin and Gemcitabine (GC) and Durvalumab | 0.74 | 0.63–0.87 | 1.6 | 65 |
| Non-small cell lung cancer squamous | Cisplatin and Gemcitabine (GC) and Necitumumab | 0.84 | 0.74–0.96 | 1.6 | 44 |
| Biliary tract cancer | Cisplatin and Gemcitabine (GC) and Pembrolizumab | 0.83 | 0.72–0.95 | 1.8 | 68 |
| Non-small cell lung cancer | Carboplatin and Gemcitabine (GCb) | 0.81 | 0.71–0.93 | 1.8 | 42 |
| Pancreatic cancer | NALIRIFOX | 0.83 | 0.7–0.99 | 1.9 | 67 |
| Head and neck cancer | Celecoxib, Erlotinib, Methotrexate | 0.63 | 0.47–0.83 | 1.9 | 58 |
| Non-small cell lung cancer nonsquamous | Carboplatin and Paclitaxel (CP) and Bevacizumab | 0.79 | 0.67–0.92 | 2.0 | 164 |
| Esophageal squamous cell carcinoma | Ipilimumab and Nivolumab | 0.78 | 0.62–0.98 | 2.0 | 81 |
| Small cell lung cancer | Carboplatin and Etoposide (CE) and Atezolizumab | 0.76 | 0.6–0.95 | 2.0 | 60 |
| Non-small cell lung cancer | Erlotinib monotherapy | 0.70 | 0.58–0.85 | 2.0 | 58 |
| Pancreatic cancer | Gemcitabine and nab-Paclitaxel and TTFields | 0.82 | 0.68–0.99 | 2.0 | 46 |
The full 150-regimen ranking, component-drug detail and methodology accompany this note in the supporting workbook.
Download the supporting workbookXLSX · full 150-regimen ranking + low-value quadrant · component-drug detail4.4 The pattern: add-on agents, later lines
The low-value zone is not randomly distributed. Three regularities stand out, and each carries a commercial and a policy reading:
It is dominated by “add-on” regimens. A targeted agent, checkpoint inhibitor or monoclonal antibody bolted onto an existing chemotherapy backbone. The added agent brings the price and much of the toxicity; the incremental survival is often slim.
It lives in non-curative, later-line settings. Almost every entry is metastatic or subsequent-line disease, where absolute gains are inherently compressed but per-patient cost is not.
The heaviest toxicity buys the least. The most toxic points on the map — antibody-augmented combinations — sit squarely in the marginal band, not the high-benefit tail.
5. Interpretation and implications
5.1 For funders and formulary design
The map is a triage lens, not a denial list. It flags where a value-based negotiation, a managed-entry arrangement or a toxicity-aware prior authorisation is most warranted — a shortlist of where the benefit-to-burden case is weakest, to be tested against current evidence and the individual clinical picture rather than applied mechanically.
5.2 For manufacturers and market access
It is a candid mirror: the absolute-benefit and toxicity story a payer will increasingly assemble for itself from structured data, and therefore the story worth pre-empting with real-world value evidence, tolerability data and outcome-based proposals before a formulary committee builds the case unaided.
5.3 For health-technology infrastructure
Methodologically, the exercise shows that once trial outcomes and drug-safety data are structured and linked, a value map that once required a manual health-technology-assessment effort can be regenerated across the whole armamentarium on demand — and kept live as new approvals land, rather than frozen at the date of a one-off appraisal.
6. Limitations
Stated plainly. The toxicity index counts the breadth of common adverse reactions, not their severity or grade: a life-threatening reaction and a mild one each count once. A handful of chemotherapy backbones with incomplete adverse-reaction records are under-counted, and 19 of 150 regimens lacked usable drug-level toxicity data — retained in the ranked table but excluded from the map. Median overall survival is trial-reported and unadjusted for cross-trial differences in population, era or crossover; absolute gains derived from separate medians can differ slightly from a formal restricted-mean analysis. A small median gain can still be meaningful for an individual patient, or conceal a long-lived tail of responders that median OS does not capture. This is a hypothesis-generating value lens, not a clinical directive, and it does not incorporate price — the natural next axis.
7. Conclusion
Modern oncology has quietly accumulated a large class of treatments that are statistically proven and clinically marginal — and the most toxic and expensive of them are not, on the whole, the ones extending life the most. None of this is visible from hazard ratios alone. It becomes visible the moment benefit, toxicity and treatment context are placed on the same structured footing and mapped together. That map is now cheap to build, easy to refresh, and overdue as an input to the decisions that determine who is funded for what.
References and sources
The following sources provide the data provenance, methodological framing and policy context. The quantitative analysis itself uses the independently developed Froome Close research dataset described in §3.
- 1. Froome Close research dataset and oncology regimen library — independently developed structured evidence base linking trial-level survival endpoints and drug-level safety data (see §3).
- 2. ClinicalTrials.gov (NCT). U.S. National Library of Medicine — registry of clinical studies and reported outcomes.
- 3. PubMed. U.S. National Library of Medicine — biomedical literature index used for structured survival-endpoint capture.
- 4. Curated drug-level adverse-reaction frequency catalogue (clinical drug reference compendium), used to derive the >10% common-toxicity banding.
- 5. Cherny NI, et al. ESMO-Magnitude of Clinical Benefit Scale (ESMO-MCBS). European Society for Medical Oncology — framework grading the magnitude of clinical benefit of cancer therapies.
- 6. Schnipper LE, et al. ASCO Value Framework. American Society of Clinical Oncology — framework weighing clinical benefit, toxicity and cost.
- 7. Council for Medical Schemes; Medical Schemes Act 131 of 1998 and Regulations — prescribed-minimum-benefit “treatable” cancer definition; companion analysis of advanced solid-organ malignancy.
Source: Froome Close research dataset — structured trial outcomes linked to a drug-level adverse-reaction catalogue. Analysis current as of this note’s preparation.
About the author
Dr Nicholas Downey · MBBCh (Cum Laude)
Physician · Oncology & Haematology Medical Advisor
Dr Nicholas Downey is a physician (MBBCh, cum laude, University of the Witwatersrand) working in oncology and haematology within managed care. As a medical advisor he leads oncology funding and prescribed minimum benefit (PMB) determinations for medical schemes, and builds the clinical decision-support, drug-safety and health-economics tools published under Froome Close. He is the author of this analysis, including the custom evidence program that structures survival data from ClinicalTrials.gov and PubMed and links it to the Froome Close oncology regimen pricing database.
LinkedIn →